As of September 5, 2026
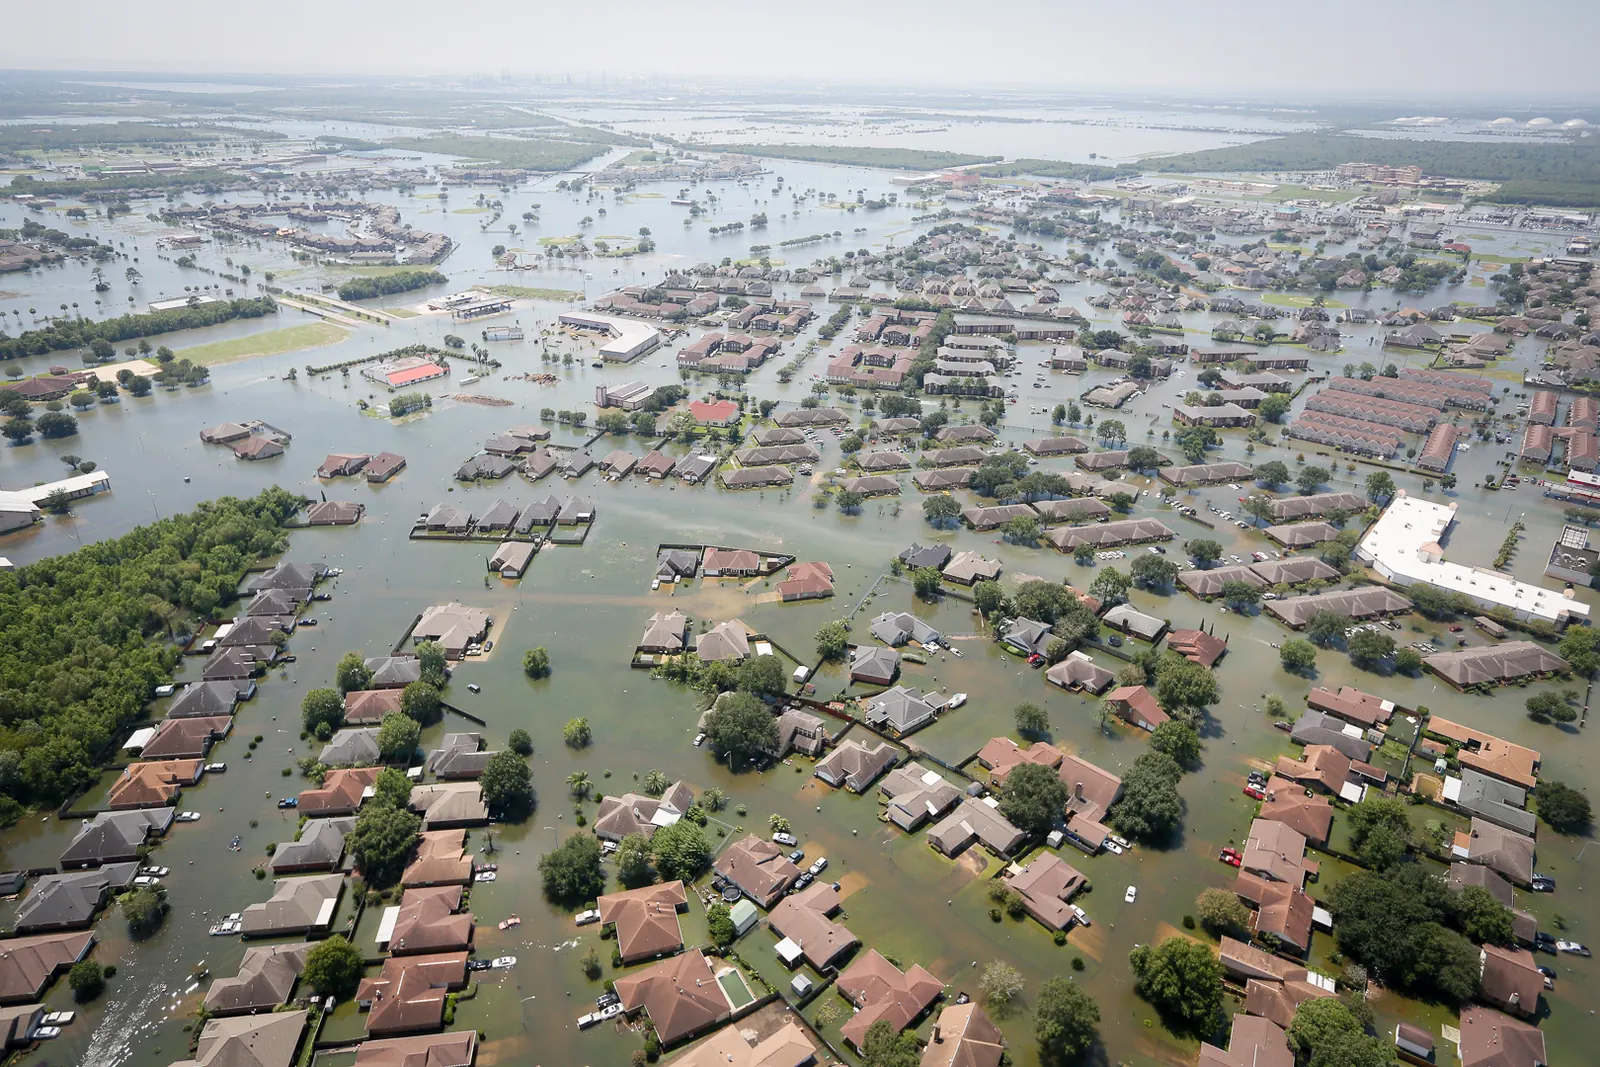
El Niño has taken hold in 2026 and is likely to strengthen further through the end of the year. Worldwide, this shifts the risks of flooding, drought, heat and wildfires. According to the World Meteorological Organization, the event is almost certain to persist through the 2026/27 northern winter. (WMO, September 3, 2026)
For disaster management, this is initially a long-range warning, not yet a concrete operational situation. It only becomes actionable once regional forecasts are matched with conditions on the ground: Which access road is at risk if it floods? Where would pumps or drinking water be lacking in an emergency? Which shelter still has capacity? And how does new situational information reach the unit that is already on the move?
Fire services, relief organizations, municipal crisis management teams and critical infrastructure operators therefore face a task that goes far beyond the weather. Many individual reports have to be turned into a shared and reliable overview. Digital situational awareness with ATAK can help.
What Is El Niño?
El Niño is the warm phase of the El Niño–Southern Oscillation, or ENSO for short. During El Niño, surface waters in the central and eastern tropical Pacific warm up unusually strongly. At the same time, the atmosphere changes, and so do the trade winds that normally push warm surface water westward.
As the warm water shifts, so do the areas of intense cloud formation and heavy rainfall. Through the large-scale circulation of the atmosphere, the effects are felt far beyond the Pacific. In some regions, the likelihood of exceptionally wet months increases; in others, the likelihood of drought.
El Niño events occur irregularly, roughly every two to seven years, and often last nine to twelve months. La Niña is the cold phase of ENSO. Today, this natural climate pattern meets an already warmer world, which can make heat and extreme rainfall more severe. (WMO: basics and typical impacts)
It is important to distinguish between climate and weather: El Niño shifts probabilities, but it does not provide a forecast for any individual city or municipality.
The Current Outlook for 2026/27
Two statements are particularly relevant for operational planning:
- El Niño is already here. In its update published on September 3, the WMO describes the event as firmly established. For September to November 2026 and December 2026 to February 2027, it expects El Niño conditions with near-100% probability. (WMO update)
- A very strong event is likely. NOAA’s Climate Prediction Center puts the probability of a very strong El Niño in fall and winter 2026/27 at more than 90 percent.
These two figures do not refer to the same thing: one describes how likely El Niño is to persist, the other its expected strength. Neither says how likely a disaster is in any particular country.
The widely used term “Super El Niño” is also of limited help in operational planning. It is not one of the WMO’s standardized categories. What matters more is what weather and hydrological services expect for the region in question.
Where El Niño Can Have Which Impacts
A stronger El Niño does not mean that it will rain more everywhere or get hotter everywhere. Season, location and other climate patterns also play a role.
The following overview shows typical relationships. It is not a specific country forecast for 2026/27. The last column translates the known patterns into practical questions for operational preparedness.
| Region | Typical link to El Niño | Possible focus of preparedness |
|---|---|---|
| Central America and parts of the Caribbean | Often less and more erratic rainfall | Drinking water supply, supply routes and longer-lasting support needs |
| Southern Brazil, Uruguay and northern Argentina | Often above-average rainfall | Flooding, evacuation, water rescue and disrupted transport links |
| Indonesia and parts of northern and eastern Australia | Often drier conditions | Wildfires, firefighting water supply and remote operational areas |
| Southern Africa | Increased likelihood of rainfall deficits | Water scarcity, crop failures and relief logistics |
| Parts of East Africa | Often more rain during the October–December short rains | Flooding, landslides and access to settlements |
| Southern United States | Often increased precipitation | Flood situations and protection of critical infrastructure |
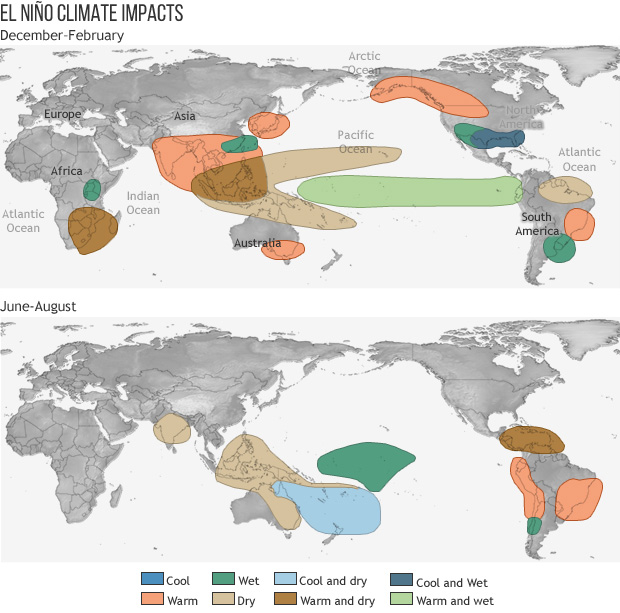
The regional patterns are described by the WMO and, for Latin America and the Caribbean, by the IFRC in an article published by the WMO. East Africa shows why the season matters: while El Niño can intensify the October–December short rains there, northern parts may also see less rainfall during the June–September rainy season.
Does El Niño Lead to More Hurricanes?
In the Atlantic, El Niño usually dampens hurricane activity. Stronger vertical wind shear – a change in wind with altitude – can make it harder for tropical cyclones to develop. NOAA’s outlook for the 2026 Atlantic season also takes this effect into account. Nevertheless, a single storm can still make landfall; the expected overall activity says nothing about that.
In the central and eastern Pacific, on the other hand, conditions for hurricanes can become more favorable. The blanket statement that El Niño brings more tropical storms worldwide would therefore be wrong.
What El Niño Means for Germany and Europe
For Germany, the connection is weaker and more indirect than in many tropical regions. El Niño does influence the large-scale circulation, but how the weather in Europe actually develops also depends on other weather systems. A strong El Niño therefore allows no conclusions about a cold German winter or a specific flood situation. Germany’s National Meteorological Service (Deutscher Wetterdienst, DWD) explains these limits in an article on the possible consequences for Europe.
Organizations with international areas of operation should include regional ENSO forecasts in their anticipatory planning. For local emergency response, however, current weather warnings, hydrological forecasts and the situation observed on the ground remain decisive.
The basic organizational task does not change: hazards, affected infrastructure and available resources must be considered together. This applies to El Niño just as much as to other major extreme weather events.
How an Early Warning Becomes a Decision
A warning only helps if it is clear who derives which action from it. According to the UN Office for Disaster Risk Reduction (UNDRR), effective early warning comprises risk knowledge, monitoring and forecasting, warning communication and a prepared response.
For operational planning, this results in three time horizons:
| Time horizon | Relevant information | Possible decision |
|---|---|---|
| Months before a possible event | Seasonal forecasts and regional risk assessments | Prepare equipment, personnel, maps and partnerships |
| Days to hours before | Specific weather and flood forecasts | Adjust readiness levels, pre-position resources, trigger predefined steps |
| During the event | Observations, measurements, closures and field reports | Change priorities, direct resources and check whether the measures taken are working |
The transition between these levels is often the hard part. A warning polygon does not show whether a care home can only be reached via a bridge at risk. Conversely, a vehicle’s position says nothing about whether the team is available or already committed.
A useful common operational picture must therefore connect three things: the hazard, its possible consequences and the available options for action. This requires shared data and clearly agreed reporting channels.
ATAK in Disaster Management
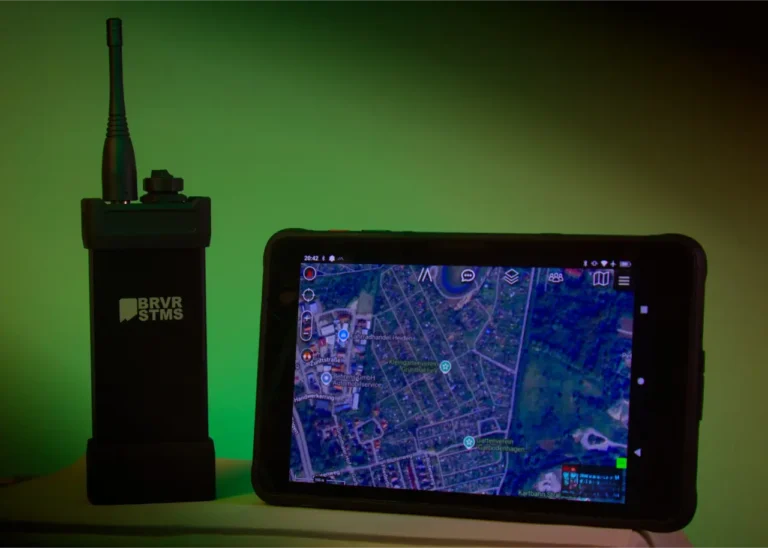
In a civilian context, ATAK stands for Android Team Awareness Kit. The application combines digital maps with position data and the exchange of operational information. Teams can share points, routes, areas and files and view them directly in their spatial context.
The report “Access to shelter blocked” thus becomes an entry at the affected location. Others can see which route is closed, when the report came in and what additional information is available. If you are new to ATAK, our introduction to the Android Team Awareness Kit covers the basics.
The TAK ecosystem also includes WinTAK for Windows, iTAK for iOS and WebTAK for the browser. This allows field teams and command posts to work together with the applications that suit them. Features and extensions vary by client. A TAK Server handles the exchange of information across different networks.
A Real-World Example
In Colorado, the state’s Center of Excellence operates the Colorado Team Awareness Kit, or COTAK. The service provides public safety agencies with position data and other situational information on mobile devices. Its users include fire departments, law enforcement and search and rescue organizations. (Colorado Center of Excellence, COTAK)
The TAK Product Center also describes how a TAK Server was connected to a government geospatial portal for wildfire maps and other situational information. There, specialist data and responder positions are brought together in a single system. (TAK: Fire, Emergency Management & First Responders)
What Belongs in a Digital Common Operational Picture
In floods, wildfires or supply emergencies, four coordinated layers have proven useful:
| Layer | Examples | Value for command |
|---|---|---|
| Hazards | Warning areas, expected inundation areas, current measurements | See where the situation could escalate |
| Exposure | Settlements, care facilities, waterworks, transport routes | Assess which consequences would be most severe |
| Resources | Teams, vehicles, pumps, boats, shelters | Assess available assistance and access options |
| Ongoing operations | Closures, reconnaissance tasks, verified routes, field reports | Keep track of responsibilities and progress |
Possible sources include Germany’s cross-state flood portal with official warnings and the map products of the Copernicus Emergency Management Service. In addition, there are municipal geodata, your own resource lists and reconnaissance reports.
How this information is integrated depends on the source. Options include supported map formats and map services, prepared data imports or custom-built interfaces. Sensor readings and drone video also need suitable integration. TAK’s plugin concept makes such extensions possible, but it does not automatically connect every conceivable data source.
A simple rule helps with data quality: every report relevant to a decision needs a location, a time, a source and a processing status. An old gauge reading must not look like a current measurement. Likewise, a reported closure must be distinguishable from a confirmed one. Such rules belong in the reporting concept and must be reflected in the technical setup.
Practical Example: A Flood Response with ATAK
The following scenario is fictitious. It shows a possible sequence of events with prepared data, established connections and agreed reporting channels.
A regional weather service is forecasting persistent heavy rain. According to the flood forecast, several villages could be affected. One of them is home to a care facility whose main access road runs through a low-lying area.
Before the event, the command post compiles hazard areas, access routes, shelters and staging areas. The data is distributed to the devices in use. For the care facility, information on transport needs, contact persons and a possible alternative route is available.
During reconnaissance, a team finds that the main access road is already flooded. It marks the section on the map, adds the time and a photo and sends the report to the command post. There, it is verified according to the agreed procedure. Another team is then tasked with scouting the alternative route.
The map now shows which transport resources are available and which routes have already been checked. The teams’ availability still has to be confirmed. Tasks and feedback can be tracked according to the established procedure; structured task management may require an additional extension.
When handing over to the next command shift, the current status is preserved: confirmed closures, open reconnaissance tasks and ongoing operations. Which information is stored and passed on, however, must be defined in advance.
The real benefit lies in the connection. An observation on the ground becomes the basis for a concrete decision. Even so, an alternative route drawn on the map remains just a planning proposal until someone has checked that it is passable.
Does ATAK Work Without Internet?
Yes. Prepared maps and locally stored operational data can be used without internet access. The TAK Product Center also describes the direct exchange of certain situational and chat data between devices on the same network, without the need for a central server.
Planning should consider three cases separately:
- A completely isolated device can still access its locally stored data. New information from other teams only arrives once a connection is available again.
- If the local network is still working, suitable Wi-Fi or radio links can enable data exchange within the area of operations. An on-site server can provide additional functions.
- If the area of operations has an external connection, cellular networks, suitable satellite links or other data paths connect the teams with remote command posts.
The TAK Product Center describes such operating modes based on field trials in Colorado. Which functions are actually usable depends on the network and its capacity.
A TAK Server is one service within the communication architecture. It does not establish a radio link itself. Retransmitting data after an outage must also be set up and tested for the data types, clients and extensions in use. Local offline use does not automatically mean that everything will later be synchronized without gaps.
For a resilient TAK Server solution, it must therefore be clear which information takes priority when bandwidth is limited. Position and status reports, for example, can be more important than a video stream.
A Sensible Way to Get Started with Digital Situational Awareness
An organization is best off starting with a manageable scenario, such as scouting and closing roads after heavy rain. This quickly shows whether the system holds up in day-to-day operations.
Before such a pilot, five questions should be answered:
- Which decision should be better supported? For example, selecting a reachable shelter or assigning a reconnaissance team.
- Which data is needed for this? This includes the source, update frequency and the responsible body.
- Who reports, who verifies and who decides? These roles must be unambiguous, especially when several organizations work together.
- What still works during a communications or power outage? You need offline data, a suitable power supply and a practiced fallback procedure.
- How can the benefit be measured? One yardstick could be how quickly a confirmed road closure reaches all affected teams, or how many follow-up questions are needed during a situation handover.
Only then comes the technical architecture. End-user devices, server operations, access rights, data connections and communications must match the requirements identified. Training and hands-on exercises then show whether a clear and up-to-date picture emerges even under time pressure.
FAQ: El Niño, ATAK and Disaster Management
How Long Is El Niño 2026 Expected to Last?
The WMO expects El Niño conditions with near-100% probability through December 2026 to February 2027. This does not give a precise end date.
Can ATAK Predict Floods or Wildfires?
No. ATAK is a platform for situational information and collaboration. Forecasts come from weather, hydrological or other specialist systems. Their results can be fed into situational awareness work in a suitable form; the forecast itself still comes from the respective source system.
Does ATAK Replace the Dispatch Center or Mission-Critical Radio?
No. ATAK complements spatial situational awareness and the exchange of operational information. Dispatch procedures, command responsibility, voice communication (e.g. TETRA) and the application must be aligned within the operational concept.
Does ATAK Always Need a Server?
Not for every function. Local map work and certain forms of collaboration on the same network are possible without a central server. A TAK Server is required for connecting across different networks and for certain extensions.
How Much Does an ATAK Solution for Disaster Management Cost?
That depends on what the organization actually needs. Depending on the setup, the budget covers end-user devices, server operations, data connections, communications equipment, training and ongoing support. For a reliable cost estimate, the number of users, the area of operations and the required features must first be defined.
What ATAK Could Look Like in Your Organization
El Niño 2026 is a good reason to review your own preparedness. But the ability to bring together hazard information and field reports will remain valuable for future floods, wildfires and supply emergencies as well.
Would you like to know how ATAK can support your operations coordination and digital situational awareness? TAKHUB supports you from requirements analysis through setup and integration to training your teams.
Tell us about your area of operations, the organizations involved and the information that is missing today or arrives too late. Together, we can then work out how ATAK can be connected to your existing systems and communication channels in a meaningful way.
Contact us and let’s find the right ATAK solution for you together.

Marcel Neuroth Founder and Managing Director, TAK Hub
Marcel Neuroth is the founder and managing director of TAK Hub. He served as a soldier in Afghanistan and then studied mechatronics. In Ukraine he volunteered and later coordinated operations as a mission leader, including evacuations near the front line. He used ATAK himself on these missions. Today he and his team set up TAK systems for emergency services, train their personnel and support projects in Europe, Latin America and Southeast Asia.